It’s all about metrics these days. Unquestionably metrics are essential. How could we have lived without them? Yes, some of us remember the days when metrics were not a thing… They provide an overview of application state but usually not the reason behind it.
For example let’s take peer count metric. Execution client peer count is exposed as a Prometheus metric by ethereum-metrics-exporter (which in turn uses the Ethereum’s JSON-RPC API net_peercount method, see: https://ethereum.org/en/developers/docs/apis/json-rpc/#net_peercount).
In the screenshot below we can see that our peer count for the last 24 hours hovered between 103 and 113. It looks healthy.

In the screenshot below we can see that there was a sudden drop of peers from the baseline count of 50 to zero and then recovery back to 50.
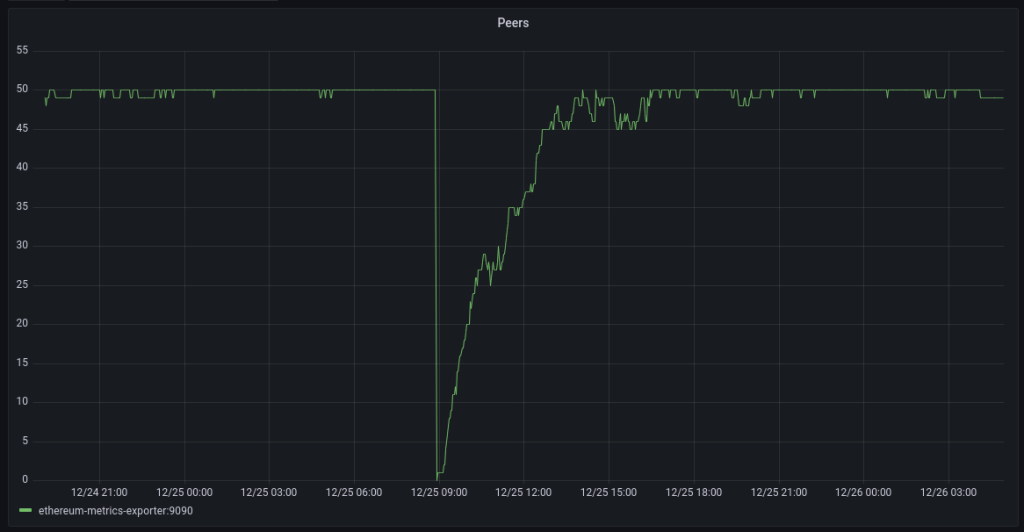
To understand why this occurred we need to dive into the logs. The logs tell us that the client was shutdown.
{"lvl":"info","msg":"Got interrupt, shutting down...","t":"2022-12-25T07:52:47.85374091Z"}
Logging summary
We use ElasticSearch for log analytics. JSON formatted logs is what we prefer. This makes it easy to feed into Elastic or parse in any other analytics solution such as Loki or SumoLogic.
We also run all applications in Docker and utilize the native logging features it provides. This becomes challenging with multiline logs but we’ll cover that in a separate post.
The table below summarizes the relevant aspects of logging available in the Ethereum execution clients.
| Client | JSON format | Multiline |
|---|---|---|
| Geth | yes | no |
| Erigon | yes | no |
| Besu | no | yes |
| Nethermind | no | yes |
Geth
Geth supports logging in JSON format. The default is text so the JSON format needs to be enabled with the –log.json flag.
Documentation reference:
https://geth.ethereum.org/docs/fundamentals/logs
Running in a container we normally use the below flags. This tells Geth to output logs to stdout at Info level.
--log.json --verbosity 3The following configuration options are available in Geth.
/ # geth --help | grep 'log\|verbosity'
    --log.backtrace value
          Request a stack trace at a specific logging statement (e.g. "block.go:271")
    --log.debug                    (default: false)
          Prepends log messages with call-site location (file and line number)
    --log.file value
          Write logs to a file
    --log.json                     (default: false)
          Format logs with JSON
    --verbosity value              (default: 3)
          Logging verbosity: 0=silent, 1=error, 2=warn, 3=info, 4=debug, 5=detail
          Per-module verbosity: comma-separated list of <pattern>=<level>
Sample log entry:
{"blocks":1,"elapsed":"294.7µs","lvl":"info","msg":"Unindexed transactions","t":"2022-12-25T07:51:48.76388003Z","tail":5846871,"txs":19}Erigon
Like Geth, Erigon supports logging in JSON format.
Documentation reference:
https://github.com/ledgerwatch/erigon#logging
Running in a container we normally use the below flags. This tells Erigon to output logs to stdout at Info level.
--log.console.json --log.console.verbosity info The following configuration option are available in Erigon.
/ $ erigon --help | grep log
   --database.verbosity value                     Enabling internal db logs. Very high verbosity levels may require recompile db. Default: 2, means warning. (default: 2)
   --sentry.log-peer-info                         Log detailed peer info when a peer connects or disconnects. Enable to integrate with observer. (default: false)
   --log.console.verbosity value                  Set the log level for console logs (default: "info")
   --log.dir.verbosity value                      Set the log verbosity for logs stored to disk (default: "dbug")
   --log.dir.path value                           Path to store user and error logs to disk
   --log.console.json                             Format console logs with JSON (default: false)
   --log.json                                     Format console logs with JSON (default: false)
   --log.dir.json                                 Format file logs with JSON (default: false)
Sample log entry:
{"eth66":"75","eth67":"33","lvl":"info","msg":"[p2p] GoodPeers", "t":"2023-01-09T11:16:47.018960771Z"}Besu
Here things get more complicated. Besu is a Java application. It uses the log4j library to manage logging. While it is possible to configure log4j to output in a structured format, there isn’t a simple flag we could pass to Besu to do it for us. Therefore we opted for the default log format and parsing the logs in Logstash. Being a Java application, Besu occasionally (info level) or very often (debug level) logs multiline Java stack traces. This poses a challenge when running in a container. This is a topic on its own and we’ll cover it in a separate post.
Documentation reference:
https://besu.hyperledger.org/en/stable/public-networks/how-to/monitor/logging/
We normally run it with the following flag:
--logging infoThe following flags are available:
besu --help | grep logging
  -l, --logging=<LOG VERBOSITY LEVEL>
Sample log entry:
2022-12-23 14:26:36.900+00:00 | vert.x-worker-thread-0 | INFO | EngineNewPayload | Imported #8,186,943 / 52 tx / base fee 97 wei / 6,434,288 (21.4%) gas / (0xeb97b760c7f678a346e6fb727d9e75a07e0578fd248bcb03d1d7b5244ac2e3b3) in 0.083s. Peers: 25Example of a multiline log entry (not Java related, just the application logging a multiline event):
2022-12-19 22:15:58.077+00:00 | vert.x-worker-thread-0 | WARN  | DefaultBlockchain | Chain Reorganization +9 new / -0 old
       Old - hash: 0x06d14c0b188230d5195843c473625762e40351c2c78b0c6a7edc9e04bb8b80d5, height: 8157677
       New - hash: 0xaed16610e95cedf3e512c16f18afb30a5f08184ad88ffd62cb9fc7b65e1262e0, height: 8157686
  Ancestor - hash: 0x06d14c0b188230d5195843c473625762e40351c2c78b0c6a7edc9e04bb8b80d5, height: 8157677
We use the following Logstsh Grok pattern to parse Besu logs:
grok {
   match => {
      "[message]"  =>
         "%{TIMESTAMP_ISO8601:t}\s\|\s%{GREEDYDATA:thread}\s\|\s%{WORD:level}\s+\|\s%{WORD:module}\s\|\s%{GREEDYDATA:msg}"
   }
}
Nethermind
Similarly to Besu, Nethermind does not natively support JSON logging and like Besu it logs multiline events. It is a .Net application and it uses the NLog library to manage logging. The detailed logging configuration can be implemented using the NLog configuration file. For our purposes, we again opted for parsing the logs in Logstash.
Documentation reference:
https://docs.nethermind.io/nethermind/ethereum-client/logging-configuration
https://docs.nethermind.io/nethermind/first-steps-with-nethermind/getting-started
We normally run it with the following flag:
--log INFOThe following flags are available:
# ./Nethermind.Runner --help | grep log
  -l|--log <logLevel>                                          Log level override. Possible values: OFF|TRACE|DEBUG|INFO|WARN|ERROR
  -lcs|--loggerConfigSource <loggerConfigSource>               Path to the NLog config file
  --Bloom.Index                                                Defines whether the Bloom index is used. Bloom index speeds up rpc log searches. (DEFAULT: true)
  --Init.LogDirectory                                          In case of null, the path is set to [applicationDirectiory]\logs (DEFAULT: logs)
  --Init.LogFileName                                           Name of the log file generated (useful when launching multiple networks with the same log folder). (DEFAULT: "log.txt")
  --Init.LogRules
Sample log entry:
2022-12-29 10:26:30.3031|ReceiptsSyncDispatcher has finished work. Example of a multiline entry:
2022-12-29 09:50:46.1943|Executing JSON RPC call engine_exchangeTransitionConfigurationV1 with params [{
  "terminalBlockHash": "0x0000000000000000000000000000000000000000000000000000000000000000",
  "terminalBlockNumber": "0x0",
  "terminalTotalDifficulty": "0xa4a470"
}]
We use the following Logstsh Grok pattern to parse Nethermind logs:
grok {
  match =>
   "[message]"  => "%{TIMESTAMP_ISO8601:t}\|%{GREEDYDATA:msg}"
  }
}
Leave a comment