This tutorial shows how to monitor eth-docker node with observability stack deployed using slingnode.ethereum_observability Ansible role. This post assumes familiarity with Ansible.
Introduction
slingnode.ethereum_observability is a part of a suite of Ansible roles designed to deploy Ethereum nodes. Currently there are three roles in the suite:
- slingnode.ethereum – deploy clients
- slingnode.ethereum_node_mgmt – manage clients
- slingnode.ethereum_observability – monitor nodes
slingnode.ethereum_observability role deploys a full monitoring stack that out of the box works with any Ethereuem client mix. The stack comprises of the following components:
- Grafana
- ELK
- Filebeat
- Prometheus
- node-exporter
- ethereum-metrics-exporter
- container advisor
slingnode.ethereum_observability role was developed to monitor nodes deployed using slingnode.ethereum role. However, it is fully customizable and can be easily adapted to monitor any Ethereum nodes.
This tutorial explains how to setup monitoring stack that runs on the same server as the clients deployed with eth-docker – all containers will be connected to the same docker network. The diagram below shows the end state.
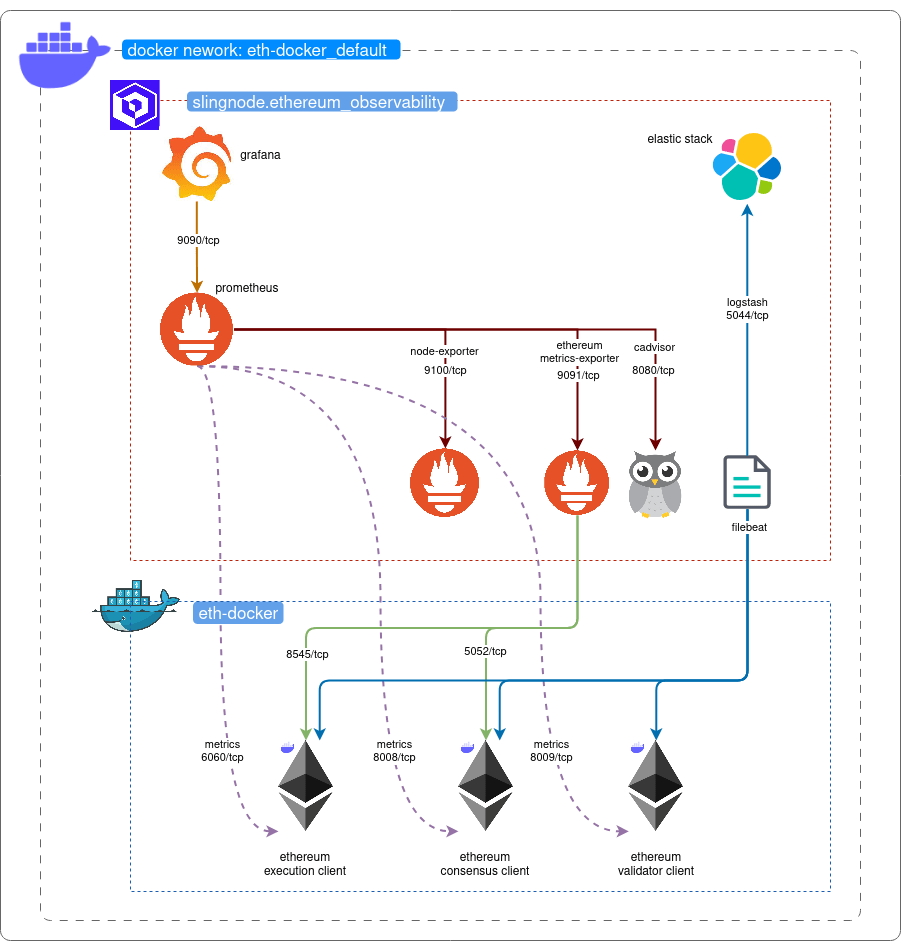
At the end of this tutorial you should end up with:
- Prometheus metrics form
- installed Ethereum clients and ethereum-metrics-exporter
- node-exporter
- container advisor
- Client logs in ELK
- Grafana with Pometheus data sources
Setup eth-docker
The first step is to install Ethereum clients using eth-docker.
- Follow the documentation to set up the node – https://eth-docker.net/Usage/QuickStart
- On the “select deployment type” screen select “Ethereum node – consensus, execution and validator client”
- Select Lighthouse, then Geth on the client select screens
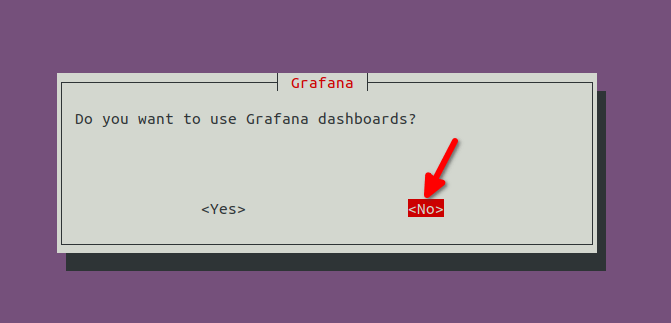
- On the “Grafana” screen select “No” – this tells ethd not to install monitoring components, since the point of this tutorial is to use external monitoring we don’t want to duplicate the containers (this would cause container name clash)
Complete the setup as normal.
Install the role from Ansible Galaxy
This post assumes you have Ansible 2.4 or newer installed and working – if not, check Ansible’s documentation for installation steps.
The slingndoe.ehtereum_observability role is published to Ansible Galaxy. To install it run the following command:
ansible-galaxy install slingnode.ethereum_observabilityYou should see the following message:
- slingnode.ethereum_observability (x.x.x) was installed successfullyCreate Ansible playbook
In this step we create a Ansible playbook where we specify the required variables and the role to use.
Copy below playbook.
| — | |
| – name: Deploy observability | |
| hosts: all | |
| become: true | |
| roles: | |
| – role: geerlingguy.docker | |
| vars: | |
| docker_package_state: present | |
| docker_install_compose_plugin: true | |
| – role: slingnode.ethereum_observability | |
| vars: | |
| clients: | |
| execution: geth | |
| consensus: lighthouse | |
| validator: lighthouse | |
| container_name_consensus: eth-docker-consensus-1 | |
| container_name_execution: eth-docker-execution-1 | |
| container_name_validator: eth-docker-validator-1 | |
| docker_network: eth-docker_default | |
| # Filbeat configuration template for eth-docker | |
| filebeat_config_template: | |
| – src: ./filebeat.yml.j2 | |
| dest: "{{ observability_root_path }}/filebeat/filebeat.yml" |
Copy Filebeat config and save it in the same directory as the playbook. Specify “filebeat.yml.j2” as the file name (it needs to match the filebeat_config_template variable). This is required to read the client logs and forward them to ELK.
| filebeat.registry.path: /usr/share/filebeat/data/registry | |
| filebeat.autodiscover: | |
| providers: | |
| – type: docker | |
| templates: | |
| # Teku, Besu and Nethermind throw multiline exceptions, Filebeat needs multiline config to handle it | |
| – condition: | |
| or: | |
| – contains: | |
| docker.container.image: besu | |
| – contains: | |
| docker.container.image: nethermind | |
| – contains: | |
| docker.container.image: teku | |
| config: | |
| – type: container | |
| paths: | |
| – /var/lib/docker/containers/${data.docker.container.id}/*.log | |
| multiline.type: pattern | |
| multiline.pattern: '^[0-9]{4}-[0-9]{2}-[0-9]{2}' | |
| multiline.negate: true | |
| multiline.match: after | |
| fields: | |
| log_type: docker | |
| fields_under_root: true | |
| – condition: | |
| or: | |
| – contains: | |
| docker.container.image: geth | |
| – contains: | |
| docker.container.image: erigon | |
| – equals: | |
| docker.container.labels.com.docker.compose.service: consensus | |
| – equals: | |
| docker.container.labels.com.docker.compose.service: validator | |
| config: | |
| – type: container | |
| paths: | |
| – /var/lib/docker/containers/${data.docker.container.id}/*.log | |
| fields: | |
| log_type: docker | |
| fields_under_root: true | |
| output.logstash: | |
| hosts: ["{{ container_name_elk if single_server_deployment else monitoring_server_host }}:{{ logstash_port }}"] | |
| enabled: true | |
| timeout: 15 |
Create Ansible inventory to run your playbook against.
- If you’re running Ansible on the same server where the clients are running use the below inventory and modify the playbook to use “connection: local”
#hosts.ini
[localhost]
127.0.0.1- If you run it against a remote server, you need to enter the server IP or a DNS name instead, e.g.:
#hosts.ini
[ethereum_servers]
x.x.x.x
To run the Playbook execute the following command:
ansible-playbook playbook.yml -i hosts.iniNote: you may need to append specify user name and password/private key depending on how you authenticate.
Let’s explain the variables we set in the playbook while Ansible is running.
Playbook variables
This section explains the variables used in the Playbook.
clients variable let’s you specify the clients to monitor, modify this based on the clients you installed using eth-docker
container_name_* These variables need to be adjusted in other to match the docker container names that eth-docker uses, which differs from the slingnode.ethereum role
filebeat_config_template point to the path where you stored filebeat.yml.j2. This lets us customize Filebeat configuration.
docker_network docker network name needs to match so that the observability containers will have access to the client container ports where the metrics are exposed.
Check the role documentation for more details on the variable and configuration options.
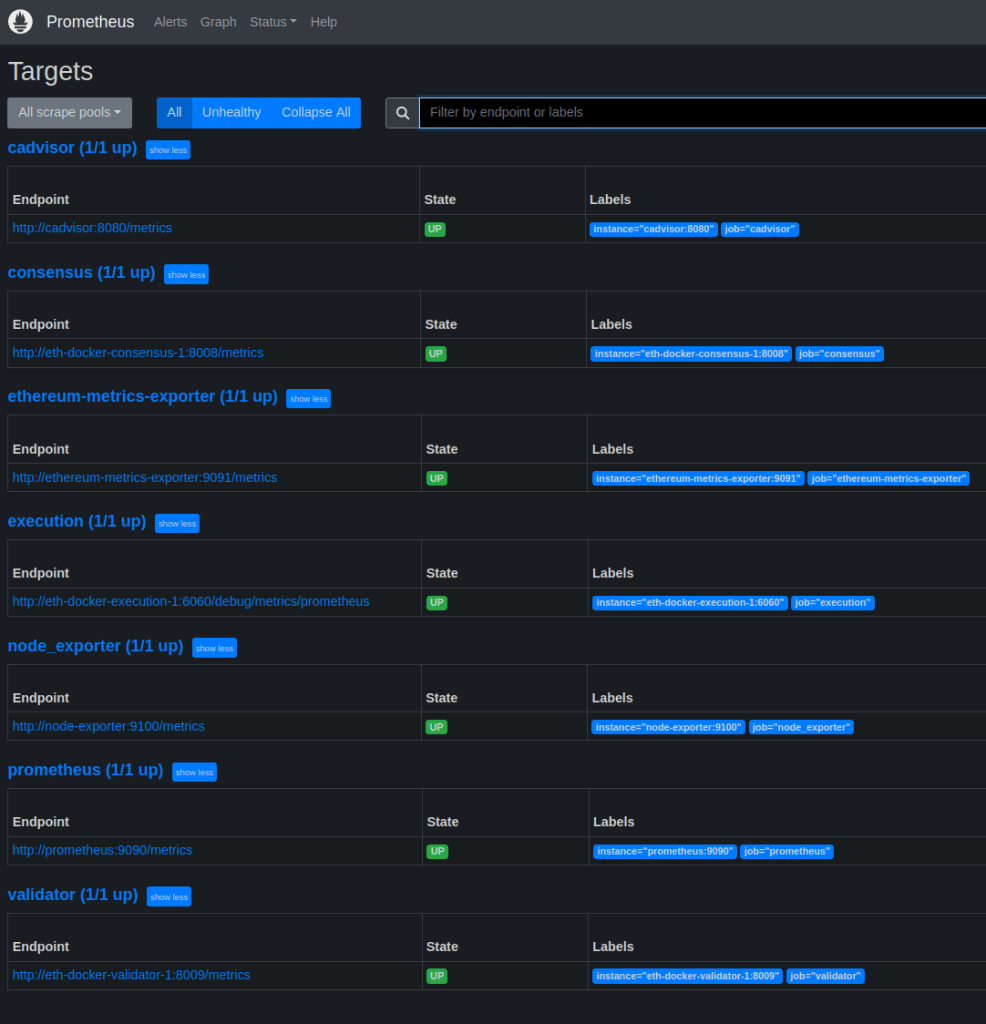
Verify the metrics and the logs
First let’s verify that Prometheus is able to fetch the metrics. We can do that by going to the Prometheus’ UI. If you are connected to the same server you can access it using the following URL:
http://localhost:9090/targets
You should see all metric endpoints in a healthy state as shown below:
Next let’s see Grafana at:
http://localhost:3000/
default user: admin
default password: admin
You can import the dashboards you want by going Dashboards>Import and specifying IDs. For example: 16277 for https://grafana.com/grafana/dashboards/16277-ethereum-metrics-exporter-single/?plcmt=footer
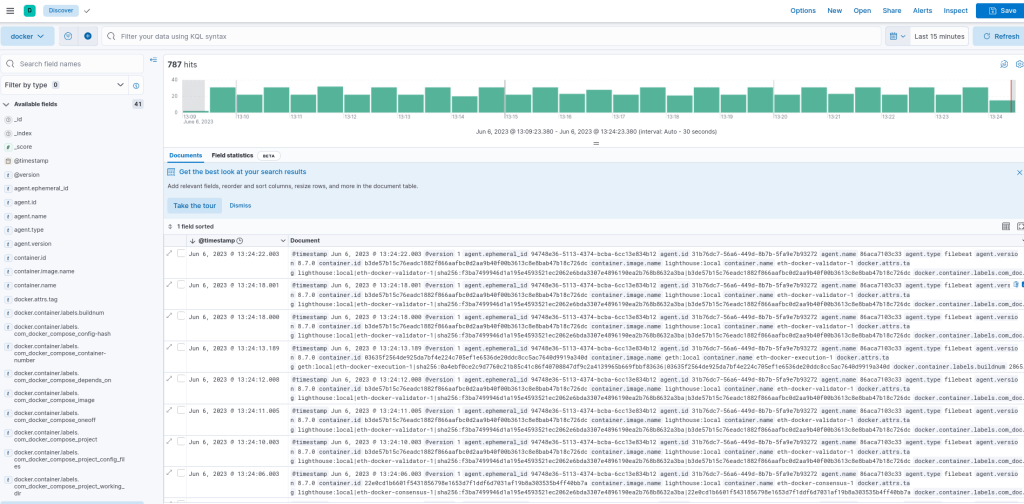
Next we can verify that client logs are available in ELK. Access Kibana at:
In order to see the logs we need to create a Data View. Follow the steps described here:
https://docs.slingnode.com/slingnode.ethereum_observability/components/elk/creating-kibana-data-view
Summary
In this tutorial we setup a full monitoring stack for eth-docker. If you have any questions or suggestion let us know in Discord or Github.
In the next post we will cover how to monitor remote machines using SlingNode role. In the meantime check out out our client deployment role’s documentation at https://docs.slingnode.com/slingnode.ethereum/. Using this role you can deploy multiple nodes in one go!

Leave a comment