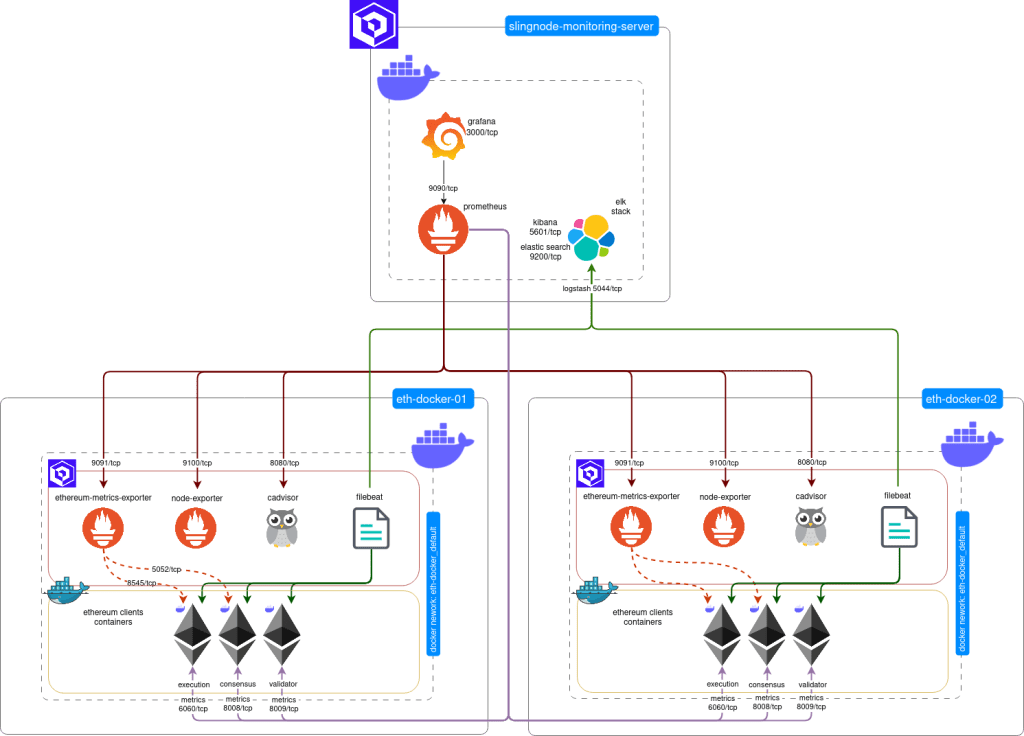
This is a part 2 of our tutorial showing how to use SlingNode’s Ansible role to monitoring Ethereum clients installed with eth-docker. Part 1 covered a single server scenario where the monitoring components ran on the same server as the eth-docker clients. Part 2 covers a more complex scenario where monitoring runs on a dedicated “central” monitoring server and monitors eth-docker nodes running on remote machines. This set up is depicted in the diagram below.
It’s worth noting that with a couple of Ansible variables you can centrally monitor many remote nodes running various client mix – slingnode.ethereuem_observability role will take care of the configuration details.
It’s recommended that you read part 1 of the tutorial first.
This tutorial assumes intermediate knowledge of Ansible, specifically using group_vars.
Overview
In this tutorial we will use a distributed architecture with a central monitoring server and multiple servers running eth-docker. Each eth-docker node will run execution, consensus and validator clients.
We assume all servers run on a local network, can freely communicate and are protected from the internet by a network firewall.
NOTE: you should not expose metric ports to the internet, nor should the metrics or log traffic be sent over the internet as it is unencrypted.
If you have nodes in different providers and you want to monitor them centrally over the internet you should at the minimum ensure the following:
- firewall rules allowing traffic only from expected sources (i.e. from the monitoring server)
- VPNs, SSH tunnels or TLS for Prometheus and Filebeat traffic
- Reverse proxy for the web interfaces (This you should in any case)
If this is the setup you want to implement, wait for part 3 of the tutorial series.
While not required you may want to review the role’s source code and documentation:
https://github.com/SlingNode/slingnode-ansible-ethereum-observability
https://docs.slingnode.com/slingnode.ethereum_observability/
Install the role from Ansible Galaxy
This post assumes you have Ansible 2.4 or newer installed and working – if not, check Ansible’s documentation for installation steps.
The slingnode.ehtereum_observability role is published to Ansible Galaxy. To install it run the following command:
ansible-galaxy install slingnode.ethereum_observabilityYou should see the following message:
- slingnode.ethereum_observability (x.x.x) was installed successfullySetup eth-docker
The “distributed” setup is more involved than a single server. eth-docker doesn’t have “native” way to expose metrics ports to the host’s IP to make them accessible from the monitoring server. To add this functionality we need to modify the relevant Docker Compose files.
NOTE: if you make this change on a server directly exposed to the internet such as most bare metal servers this will make the metrics ports accessible by anyone from the internet. Check here for explanation and tread with caution
1. Clone eth-docker repository to the servers where the clients will be running:
git clone https://github.com/eth-educators/eth-docker.git2. Based on your client selection you will need to modify the corresponding docker files to expose the metrics port to the host. In this example we use Lighthouse and Geth:
lighthouse.yml
...
services:
  consensus:
    ...
    ports:
      ...
      - ${HOST_IP:-}8008:8008/tcp
  ...
  validator:
    ...
    ports:
      - ${HOST_IP:-}8009:8009/tcp
geth.yml
services:
execution:
...
ports:
...
- ${HOST_IP:-}6060:6060/tcp3. Run eth-docker configuration, make sure you select No in the “Do you want to use Grafana dashboards?” prompt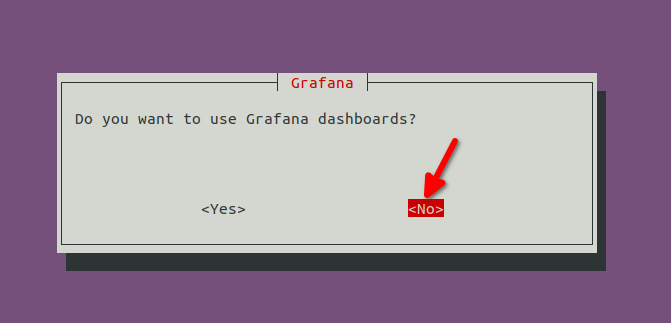
4. Start the clients
./ethd upCreate Ansible playbook and inventory
Now that the clients are ready and metrics ports are accessible from the remote hosts, we will continue to setup observability stack using slingnode.ethereuem_observability role.
1. Copy and save the filebeat.yml configuration file with the necessary configuration to be compatible with eth-docker.
| filebeat.registry.path: /usr/share/filebeat/data/registry | |
| filebeat.autodiscover: | |
| providers: | |
| – type: docker | |
| templates: | |
| # Teku, Besu and Nethermind throw multiline exceptions, Filebeat needs multiline config to handle it | |
| – condition: | |
| or: | |
| – contains: | |
| docker.container.image: besu | |
| – contains: | |
| docker.container.image: nethermind | |
| – contains: | |
| docker.container.image: teku | |
| config: | |
| – type: container | |
| paths: | |
| – /var/lib/docker/containers/${data.docker.container.id}/*.log | |
| multiline.type: pattern | |
| multiline.pattern: '^[0-9]{4}-[0-9]{2}-[0-9]{2}' | |
| multiline.negate: true | |
| multiline.match: after | |
| fields: | |
| log_type: docker | |
| fields_under_root: true | |
| – condition: | |
| or: | |
| – contains: | |
| docker.container.image: geth | |
| – contains: | |
| docker.container.image: erigon | |
| – equals: | |
| docker.container.labels.com.docker.compose.service: consensus | |
| – equals: | |
| docker.container.labels.com.docker.compose.service: validator | |
| config: | |
| – type: container | |
| paths: | |
| – /var/lib/docker/containers/${data.docker.container.id}/*.log | |
| fields: | |
| log_type: docker | |
| fields_under_root: true | |
| output.logstash: | |
| hosts: ["{{ container_name_elk if single_server_deployment else monitoring_server_host }}:{{ logstash_port }}"] | |
| enabled: true | |
| timeout: 15 |
2. Create your own playbook or use the example provided here. An Ansible inventory is also provided, remember if you want to use it you will need to update your hosts IP.
| — | |
| all: | |
| vars: | |
| monitoring_server_host: "{{ hostvars[groups['monitoring_server'][0]]['ansible_facts']['default_ipv4']['address'] }}" | |
| single_server_deployment: false | |
| monitoring_server: | |
| hosts: | |
| server1: | |
| ansible_host: 127.0.0.1 | |
| vars: | |
| monitoring_server: true | |
| install_monitoring_agents: false | |
| client_servers: | |
| hosts: | |
| server2: | |
| ansible_host: 127.0.0.1 | |
| server3: | |
| ansible_host: 127.0.0.1 | |
| vars: | |
| host_ip_address_to_bind_to: 0.0.0.0 | |
| monitoring_server: false | |
| install_monitoring_agents: true | |
| deploy_execution: true | |
| deploy_consensus: true | |
| deploy_validator: true | |
| clients: | |
| execution: geth | |
| consensus: lighthouse | |
| validator: lighthouse |
| — | |
| – name: Deploy observability | |
| hosts: all | |
| become: true | |
| roles: | |
| – role: geerlingguy.docker | |
| vars: | |
| docker_package_state: present | |
| docker_install_compose_plugin: true | |
| – role: slingnode.ethereum_observability | |
| vars: | |
| container_name_consensus: eth-docker-consensus-1 | |
| container_name_execution: eth-docker-execution-1 | |
| container_name_validator: eth-docker-validator-1 | |
| docker_network: eth-docker_default | |
| # Filbeat configuration template for eth-docker | |
| filebeat_config_template: | |
| – src: ./filebeat.yml.j2 | |
| dest: "{{ observability_root_path }}/filebeat/filebeat.yml" |
In the example inventory you can see that we have grouped the servers under monitoring_server and client_servers.
The monitoring server web interfaces (Grafana, Kibana, Prometheus) will be accessible only from the monitoring server itself (docker ports are mapped to 127.0.0.1). You could use a reverse proxy such as Nginx or ssh port tunnel to access them.
If your monitoring server is behind a firewall you can set the following variable under monitoring_server group.
host_ip_address_to_bind_to: 0.0.0.0
client_servers group must expose the agents to the host (node-exporter, cadvisor, ethereum-metrics-exporter) so the monitoring server can connect to them and retrieve the metrics.
Under client_servers group we have added the following variables to define which layers will be deployed to the client servers:
  deploy_execution: true
  deploy_consensus: true
  deploy_validator: true
As in the part 1, we have defined the container names to match eth-docker and the eth-docker docker network name.
container_name_consensus: eth-docker-consensus-1 container_name_execution: eth-docker-execution-1 container_name_validator: eth-docker-validator-1 docker_network: eth-docker_defaultAnd the clients that we want to monitor – this variable needs to match the client mix you chose to install with eth-docker.
     clients:
         execution: geth
         consensus: lighthouse
         validator: lighthouse
3. Run Ansible playbook against your hosts:
ansible-playbook -i inventory.yml playbook.ymlPrometheus targets
Prometheus supports multiple ways of configuring our scrape targets (servers to monitor) – from adding them manually to the configuration file, to using automated service discovery. Refer to the role documentation for Prometheus configuration options.
Our Ansible role by default uses file based service discovery. This let’s the role to automatically configure multiple targets and add/remove them without restarting Prometheus.
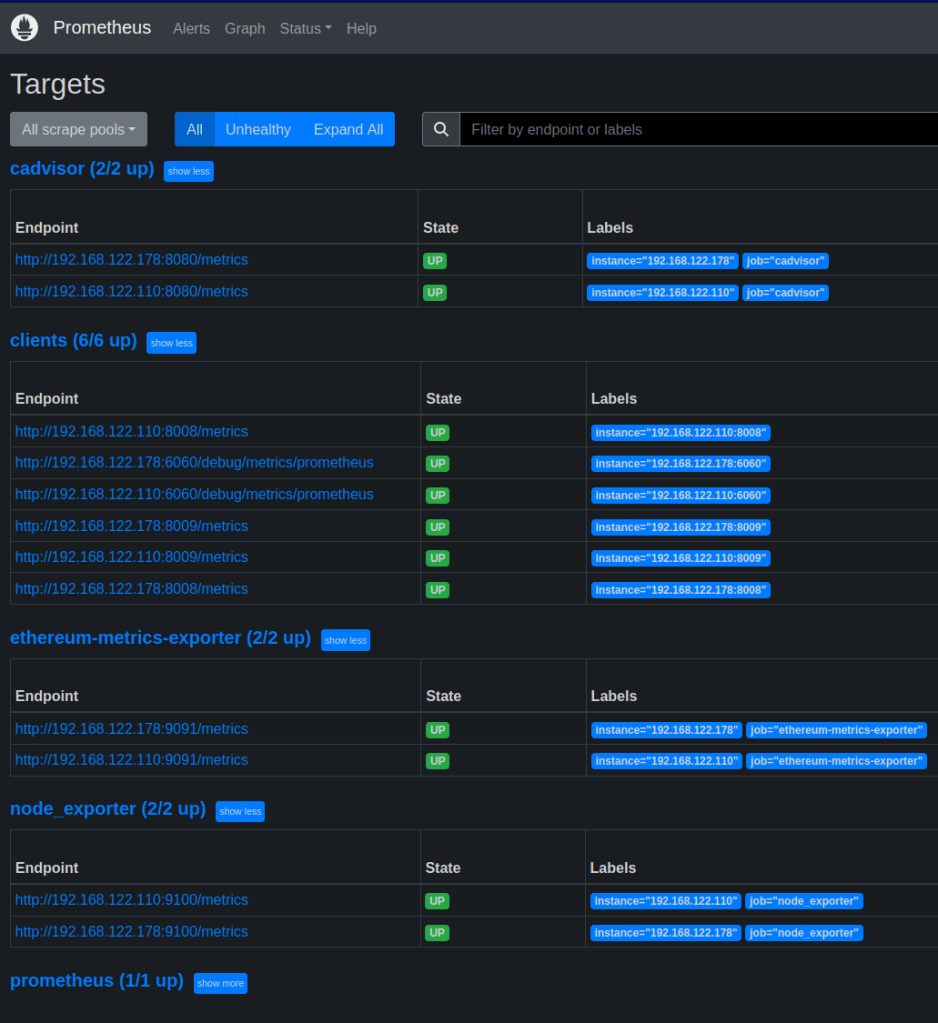
Let’s verify that everything is working
1. Go to Prometheus and check the targets to validate that they are healthy and reporting data.
http://monitoring-server-ip:9090/targets
2. Go to Grafana, create or import the dashboards to verify that the metrics are shown:
http://monitoring-server-ip:3000
user: admin
password: admin
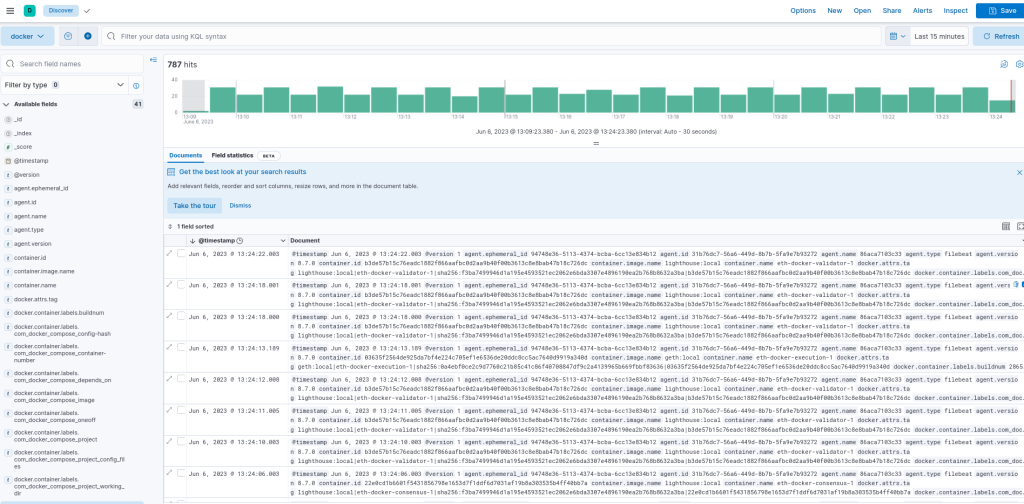
3. go to Kibana and verify that logs are ingested:
http://monitoring-server-ip:5601/
In order to see the logs we need to create a Data View. Follow the steps described here to do so:
https://docs.slingnode.com/slingnode.ethereum_observability/components/elk/creating-kibana-data-view
Summary
In this tutorial we’ve setup a full monitoring stack for multiple eth-docker nodes. You should be able to see metrics and client logs from your eth-docker nodes in central dashboards.
Please remember that this setup is only to be used on local networks. There is not authentication for the exposed metric port and the monitoring traffics is not encrypted. In the next tutorial we will build up this example and show how to harden this set up so that it could be used over the internet.

Leave a comment